Eight minutes behind with 18km to go. The race data explains how she turned it around.
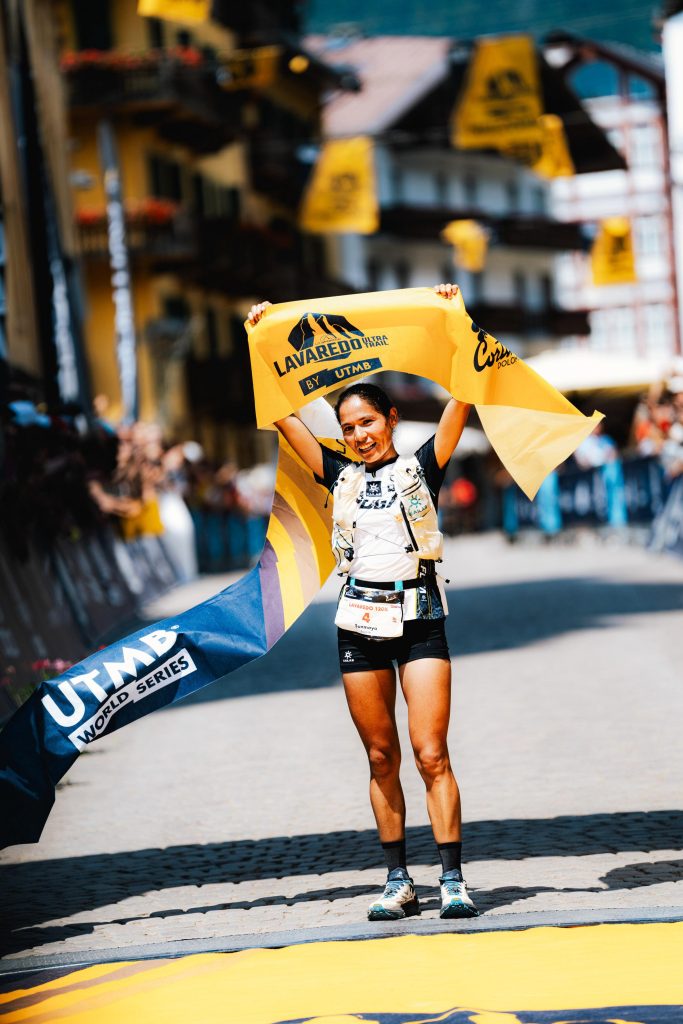
On July 27, the women’s race at the Lavaredo Ultra Trail 120km delivered something special. Not only did the first two women both finish under the long standing record set by Caroline Chaverot’s in 2015, they produced one of the most memorable battles I’ve followed in ultra running.
Nepal’s Sunmaya Budha crossed the finish line just 1 minute 41 seconds ahead of Australia’s Lucy Bartholomew after more than thirteen hours of racing.
I coach Sunmaya, so once the celebrations had settled down I had access to something most people didn’t — her race data. When I sat down at my computer on Monday morning after the race, that was the first thing I looked at.
How did she turn around an eight-minute deficit with 18km to go?
A Race That Looked Over
If you only looked at the final results, you’d probably assume Sunmaya ran a conservative first half before charging through the field late in the race. The reality was much more dramatic.
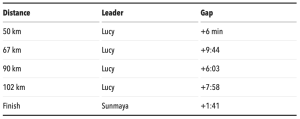
Lucy controlled almost the entire race. She climbed well, descended well, and at one stage held close to a ten-minute lead. With 20km remaining she still led by nearly eight minutes — at that point, the race looked done.
Instead, Sunmaya averaged almost 30 seconds per kilometre faster over the closing stages to win by 1 minute 41 seconds. How did she do that ?
The obvious question was whether Lucy had simply blown up. So I went back and looked at the closing splits from the previous course records. What surprised me was that Lucy’s closing split was actually faster than the closing splits of Caroline Chaverot, Rosanna Buchauer and Courtney Dauwalter during their course-record performances. Sunmaya was simply on another level again.
Looking For Answers
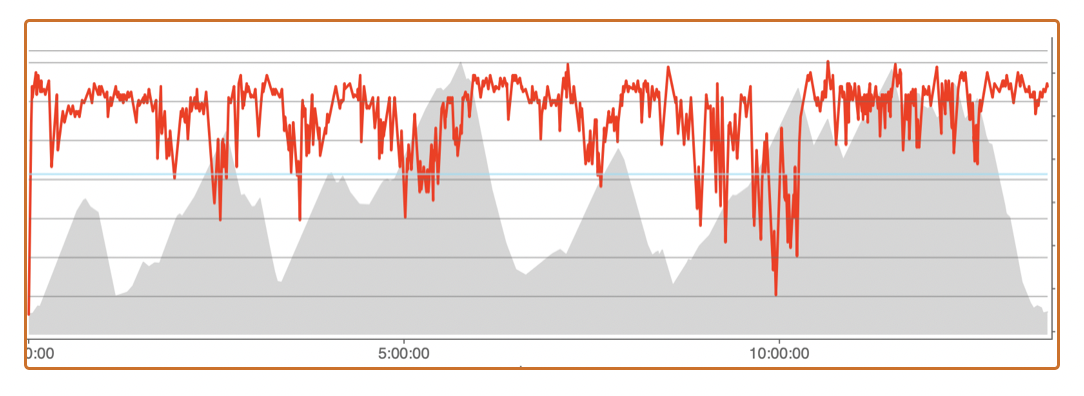
The official timing data tells us what happened. Sunmaya’s COROS watch tells us a little more about why — giving us power and heart rate throughout the race. Whenever I’m analysing a race, the first thing I look at is the power data.
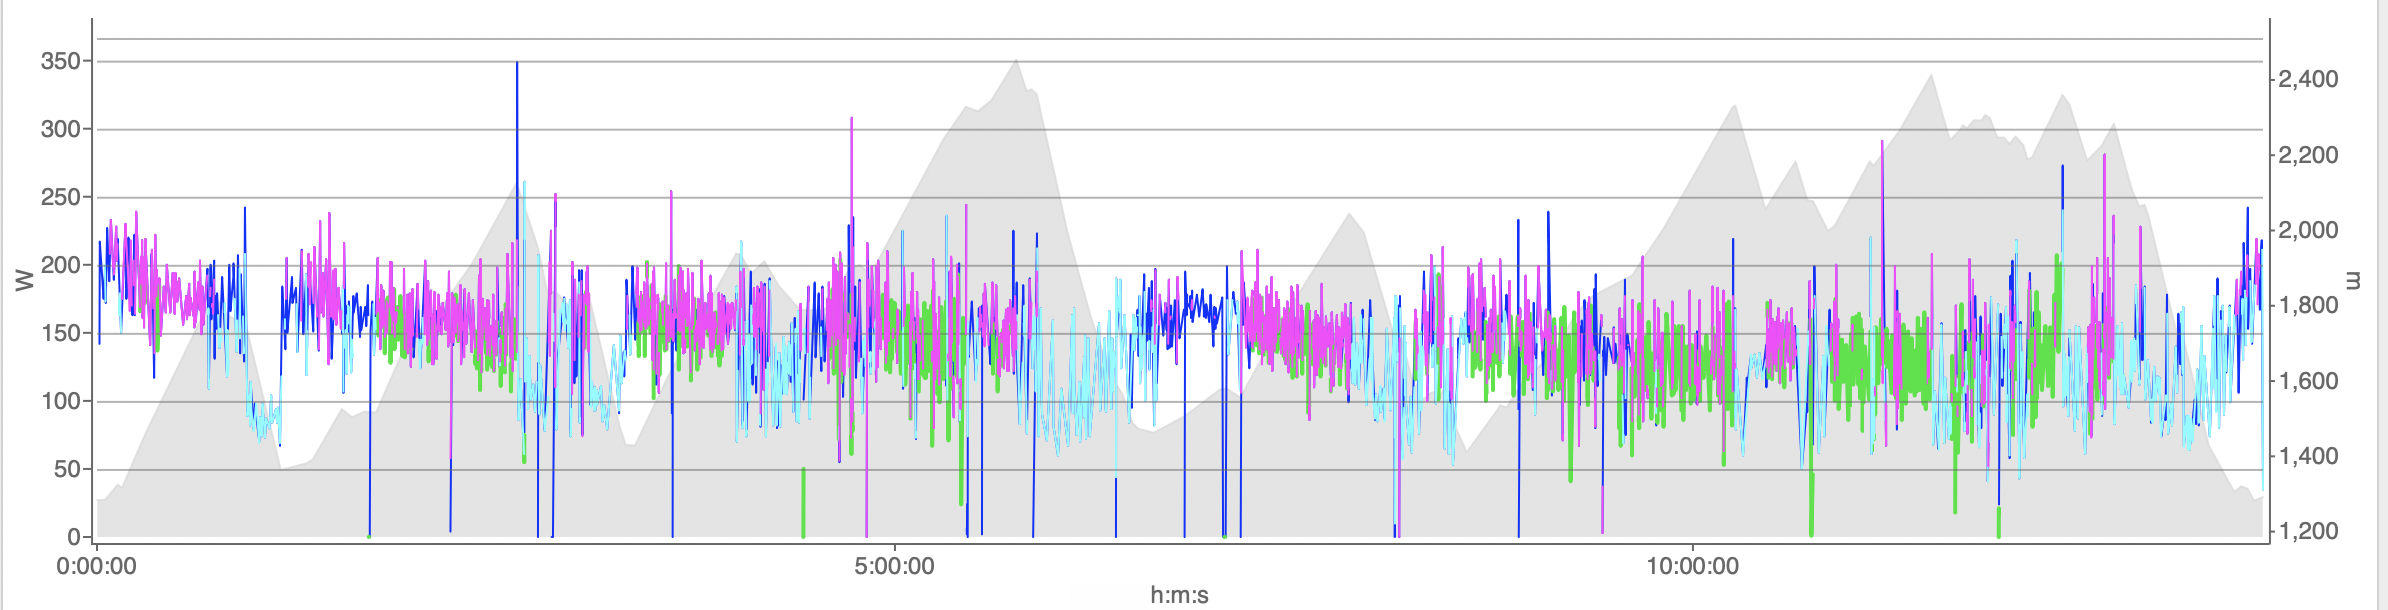
Click image to enlarge
The colours separate the different types of movement during the race: uphill running (magenta), downhill running (cyan), hiking (green) and flatter running (blue). Looking at them separately gives a much clearer picture than averaging everything together.
To make it easier to interpret, I divided the race into four equal quarters.
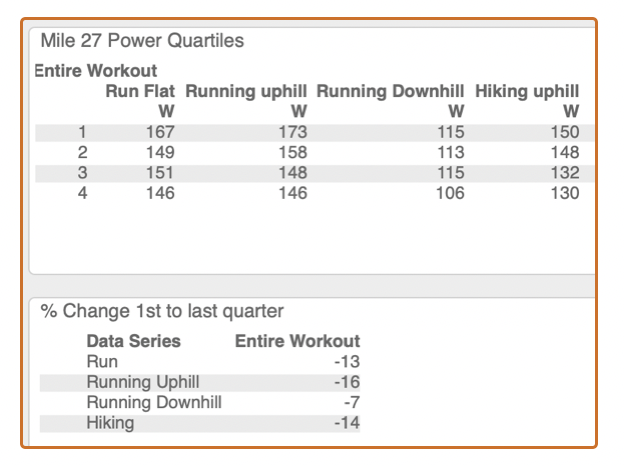
Average Power per quarter
Click image to enlarge
Starting with Power
Power fell by around 15% from the opening quarter to the final quarter, which at first seems completely at odds with what happened in the race. How can someone losing power suddenly become 30 seconds per kilometre faster than the race leader?
The answer is that a 120km mountain ultra doesn’t work like that. Everyone’s going to produce their highest power while they’re fresh. A 15% drop over thirteen hours is what I’d expect to see in a well run race.
So rather than asking how much power dropped, I started asking when it dropped.
After that opening section, the numbers hardly changed. From the second quarter onwards, her power stayed remarkably stable, even deep into the race when power is normally continuing to decline.
But That Still Didn’t Explain the Comeback
Consistent power explained why she wasn’t slowing dramatically. It didn’t explain how she was suddenly taking minutes out of Lucy. So I moved on to the heart rate data.
Click image to enlarge
As fatigue accumulates during a long ultra, athletes usually become less able to produce the same output. Even though they’re still working hard, power gradually falls and heart rate often falls with it. It’s not because they’re choosing to back off. It’s because fatigue is reducing what they’re physically capable of producing. I’ve seen literally hundreds, if not thousands, of heart rate files from ultras, and almost all show the same gradual decline. Sunmaya’s did the opposite.
Her average heart rate across the four quarters was 152, 147, 142, 158 bpm. In the final quarter, after more than ten hours of racing, she was working harder than she had been at the start. The higher heart rate didn’t cause the comeback, it reflected how hard her body was working to maintain that level of output after more than ten hours of racing.
Lifting your effort after ten hours isn’t as simple as deciding to push harder. Every instinct is telling you to back off and your legs are screaming at you to slow down. Every athlete hurts at that point. The hard part is deciding whether those sensations reflect your actual limit, or simply what ten hours of racing feels like. To go harder, you have to believe there’s still something left despite everything your body is telling you—and be willing to accept the consequences if you’re wrong. At the point where most athletes are simply trying to survive the final kilometres, Sunmaya was still increasing her effort.
If you’d met her before the race you wouldn’t have predicted it. She’s warm, playful, relaxed — not someone who projects the kind of intensity you associate with elite competition. But she has a history of doing this in other big races. At the World Trail Championships in 2025 and at CCC in 2022, she ran the fastest final section of any athlete in the field and finished second in both races. The ability to finish strongly was there each time. At Lavaredo, she reached the final 20km with the leader still within reach—and this time, that finishing strength was enough to win the race.
One Last Clue
One thing I really wanted to know was: after ten hours of racing, how much of the hills was she still able to run?
How much time Sunmaya spent hiking at each gradient
Race split into four equal quarters — green = early race, red = final quarter
Race quarter
Q2 — 30–60km
Q3 — 60–90km
Q4 — final 30km
Percentage of time spent hiking across different gradient bands. Hover over the bars for exact values.
This chart breaks the course into six gradient bands and shows the percentage of time Sunmaya spent hiking in each one across the four quarters of the race. As fatigue builds, you’d normally expect those hiking percentages to increase as athletes gradually switch from running to walking on less and less steep terrain.
On the flat and gentle gradients she ran throughout. On the steepest climbs—25% and above—she was hiking most of them from the start, exactly as you’d expect. The interesting band is 10–15%. That’s a gradient most athletes run comfortably early in a race, but by the final quarter of a 120km ultra most have switched to hiking. Sunmaya was still running around 60% of those climbs in the final quarter. Even on the 4–10% gradients—terrain that fresh athletes run without thinking—her hiking percentage barely changed across the entire race.
This helps explain how she was able to keep pushing. It wasn’t a late surge like an elite marathoner attacking the field. It was the ability to keep running terrain that many athletes at that stage of a 120km race are forced to hike.
That doesn’t mean the comeback happened only on the climbs. She also clawed back time on the flatter and downhill sections. But the fact she could still run those climbs tells us something important. After ten hours of racing, she still had the legs—and the aerobic capacity—to keep racing aggressively when most athletes were simply trying to hang on.
The heart rate graph doesn’t tell us why she could do it. It simply tells us she could. The why is more about the pacing decisions made over the first hundred kilometres, the durability developed over years of training, and the confidence to use it when the opportunity appeared.
Looking Back
When people remember this race they’ll probably focus on the finishing margin, or the fact that both women broke Caroline Chaverot’s course record. For me, the moment is the checkpoint at 102km — Lucy Bartholomew, eight minutes clear, 20km to go, and almost everyone watching would have called it done.
Looking back through the data, my first assumption was that she’d taken the time back on the descents — she’s one of the best technical descenders in the sport, and with 20km of mountain terrain remaining there was plenty of opportunity. But that’s not what the data showed. She gained on the climbs, on the descents, and on the runnable sections between them — a few seconds here, a few seconds there, until margins that individually meant nothing had quietly added up to a win.
After every race I find myself asking the same question: what actually produced that result? That’s where power data becomes valuable. On its own it’s just another number, but read alongside terrain, fatigue and pacing it helps explain how the race unfolded—and in this case, how Sunmaya came back from eight minutes down to win. Over the past few years I’ve developed my own framework for interpreting those relationships, and every race like this helps validate and refine it.